
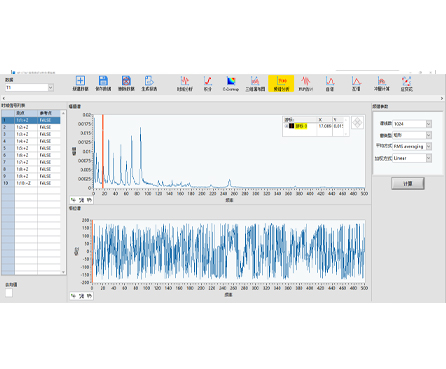
HP-STAP is a frequency-spectrum analysis software designed for fast FFT-based diagnostics. It supports both real-time and non-real-time FFT analysis, plus auto/cross power spectrum and Power Spectral Density (PSD) workflows—ideal for engineers who need clear frequency-domain insight from time-domain signals.
| Real-Time FFT Analysis | Monitor frequency changes instantly during testing and troubleshooting. |
|---|---|
| Non-Real-Time FFT Analysis | Reprocess recorded data for deeper review and repeatable comparisons. |
| PSD (Power Spectral Density) | Quantify energy distribution across frequency for noise and vibration evaluation. |
| Auto/Cross Power Spectrum | Analyze self power and cross relationships for correlation and system behavior checks. |
| Windowing & Averaging Controls | Improve spectral clarity, reduce leakage, and stabilize results for reliable decisions. |
| Weighted & Configurable Processing | Adjust analysis settings to match standards, signal types, and engineering goals. |
Product line: HP-STAP Series
Category: Spectrum / Frequency Analysis Software
Core capabilities: Real-time & offline FFT, auto/cross power spectrum, PSD analysis
Analysis controls: Spectrum line settings, windowing, averaging, weighting options
Typical outputs: Frequency spectrum, PSD curves, analysis plots and results tables
HP-STAP helps you move from raw waveform data to actionable frequency-domain results. With flexible parameter settings (such as spectrum lines, window functions, averaging, and weighting), you can tune analysis quality for different signals—whether you’re validating test data in the lab or troubleshooting field issues.
Vibration and rotating machinery frequency diagnostics (bearing/imbalance/misalignment indicators)
Noise analysis and broadband energy evaluation using PSD
Structural dynamics and test/measurement frequency-domain studies
R&D lab signal analysis for prototypes and validation testing
Condition monitoring data review and troubleshooting (FFT + PSD trend checks)
Supports time-domain signal inputs from compatible measurement/DAQ hardware (single- or multi-channel, depending on your system).
Works with common engineering signals (e.g., waveform data used for vibration/noise testing).
If you tell me your sensor type (accelerometer/microphone/strain/voltage) and hardware model, I can tailor this section into a precise, hardware-matched specification.
Analysis modes: Real-time FFT / Offline FFT
Spectrum analysis types: Auto power spectrum / Cross power spectrum / PSD (Power Spectral Density)
Configurable parameters include:
Spectrum lines (resolution setting)
Window functions (leakage control)
Averaging methods (stability and repeatability)
Weighting options (application-based emphasis)
Visualization: Frequency spectrum plots and waveform + spectrum views (typical workflow)
Q1: What’s the difference between real-time FFT and non-real-time FFT?
Real-time FFT updates continuously during acquisition, while non-real-time FFT processes recorded data for repeatable analysis and deeper review.
Q2: When should I use PSD instead of a standard FFT amplitude spectrum?
Use PSD when you need energy distribution versus frequency (especially for noise, random vibration, and broadband signals).
Q3: What do “auto power spectrum” and “cross power spectrum” mean?
Auto power spectrum focuses on one signal’s power content; cross power spectrum evaluates the relationship between two signals across frequency.
Q4: Why do windowing and averaging matter?
Windowing reduces spectral leakage; averaging improves stability by reducing random fluctuations—both help you trust the peaks and trends you see.
Q5: Can I tune resolution and smoothing?
Yes—via spectrum line settings, window selection, averaging, and weighting controls.