


HP-STAP is a signal testing, analysis, and post-processing software suite designed for engineers who need fast FFT-based insight, reliable fault diagnostics, and practical fatigue evaluation from real test data. It supports both real-time and post-event analysis workflows to help you move from raw waveforms to actionable decisions.
| Faster troubleshooting | Go from waveform → FFT → fault features without switching tools. |
|---|---|
| Stronger diagnostic confidence | Use multiple classic plots (envelope spectrum, Bode, orbit, pole plot) to cross-check fault patterns. |
| More practical durability evaluation | Estimate fatigue damage using real measurement data aligned with material fatigue behavior (S-N / Wohler). |
| Engineering-grade controls | Windowing, averaging, weighting, and spectrum line settings help improve repeatability and comparability. |
Product line: HP-STAP Series
Category: Signal test / analysis / processing software
Core capabilities:
Real-time & post-processing FFT spectrum analysis
Fault diagnosis for rotating machinery signals
Fatigue analysis based on measured structural data and material fatigue reference data (S-N / Wohler curve)
HP-STAP focuses on three high-frequency engineering tasks in one workflow:
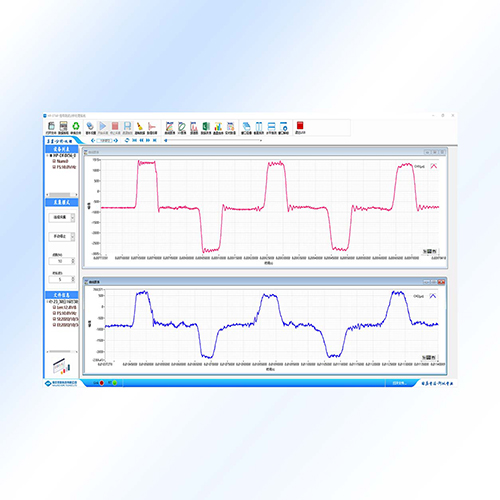
Spectrum analysis for time-domain signals (real-time or after the test), including auto power spectrum / PSD, amplitude spectrum, phase spectrum, and real/imaginary spectrum. You can configure key FFT parameters such as spectrum lines, windowing, averaging, and weighting.
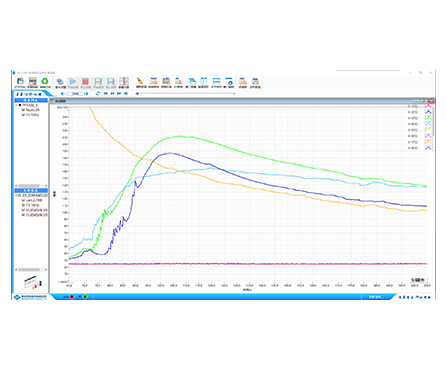
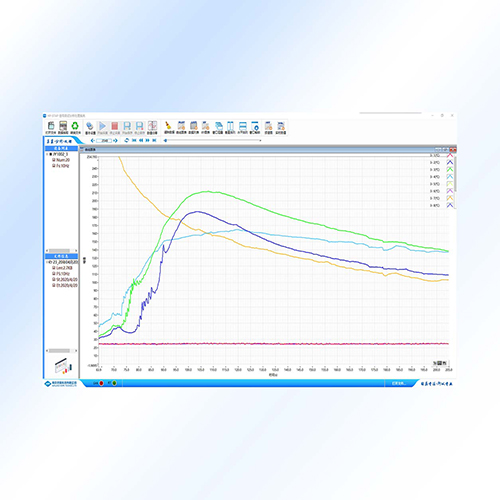
Fault diagnosis tools that support common rotating machinery diagnostics and visualization methods, such as bearing characteristic analysis, envelope spectrum, pole coordinate plot, Bode plot, shaft orbit, and shaft center position.
Fatigue analysis that compares measured data from structural tests against fatigue data obtained from material specimen testing, estimating structural damage level using S-N (Wohler) curves (S = cyclic stress, N = cycles to failure).
Rotating machinery testing and diagnostics (motors, pumps, fans, spindles, gearboxes)
Bearing health checks and fault feature extraction (envelope spectrum + characteristic frequencies)
Vibration and dynamic response analysis in test labs
Structural testing programs that require fatigue damage estimation
R&D validation, quality investigations, and failure analysis workflows
Supports analysis of measured time-domain signals used in engineering tests (e.g., vibration/rotation-related channels, structural test signals).
Enables real-time analysis during testing and post-processing after data collection.
Provides frequency-domain tools (FFT, PSD and related spectra) and diagnostic plots commonly used with rotating machinery measurement setups.
Note: The images only describe analysis functions (not file formats, DAQ brands, channel counts, or specific sensor wiring). If you share your DAQ model or data format, I can tailor this section for your exact setup.
Real-time FFT and post-event FFT analysis
Auto power spectrum / Power Spectral Density (PSD)
Amplitude spectrum, phase spectrum
Real / imaginary spectrum
Parameter settings include:
Spectrum lines (resolution)
Windowing
Averaging
Weighting
Bearing characteristic analysis
Envelope spectrum
Pole coordinate plot
Bode plot
Shaft orbit
Shaft center position (centerline) display
Compares structural test measurement data with fatigue data from material specimen testing
Estimates structural damage level
Uses material S-N curve (Wohler curve):
S = cyclic stress
N = cycles to failure
1) Is HP-STAP for real-time testing or post-processing?
Both. It supports real-time analysis and after-test FFT analysis.
2) What spectrum outputs does it provide?
Auto power spectrum (PSD), amplitude spectrum, phase spectrum, and real/imaginary spectrum.
3) Can I tune FFT settings for repeatable results?
Yes—spectrum lines, windowing, averaging, and weighting can be configured.
4) What diagnostic tools are included for rotating machinery?
Bearing characteristic analysis, envelope spectrum, pole plot, Bode plot, shaft orbit, and shaft center position.
5) What is the fatigue analysis based on?
It compares measured structural test data to material fatigue reference data and estimates damage using S-N (Wohler) curves.
6) What does S-N (Wohler) mean in this context?
S represents cyclic stress; N represents the number of cycles to failure—used to describe material fatigue behavior.
7) Does it include bearing envelope spectrum for early fault detection?
Yes, envelope spectrum is listed as a built-in fault diagnosis function.
8) What industries typically use this software?
Any team doing vibration/rotating machinery diagnostics or structural durability testing (test labs, manufacturing QA, R&D).