
HP-STAP Octave Band Analysis Software converts a discrete spectrum into standardized octave-band power spectrum results. It groups frequency bins into bands and sums the power within each band, producing clear band-level outputs such as 1/1, 1/3, 1/6, 1/12, and 1/24 octave bands for fast comparison and reporting.
| Clean, report-ready results | Turn FFT data into banded summaries that stakeholders can understand quickly |
|---|---|
| Multiple octave resolutions | Choose 1/1, 1/3, 1/6, 1/12, or 1/24 octave depending on detail needed |
| Efficient comparison | Makes it easier to compare conditions, machines, or test points using band power trends |
| Better for broad-band evaluation | Helpful when overall energy distribution matters more than single-line peaks |
Series: HP-STAP
Product Type: Octave band analysis software / octave-band power spectrum tool
Core Function: Divide a spectrum into frequency bands and calculate band power (power spectrum integration per band)
Supported Band Types: 1/1, 1/3, 1/6, 1/12, 1/24 octave
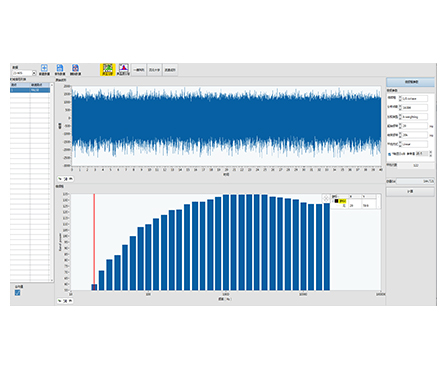
Typical Output: Octave band bar chart / band power spectrum visualization
In many noise and vibration tasks, engineers don’t want to read thousands of FFT lines—they need a banded view that summarizes energy distribution across frequency. HP-STAP performs octave band analysis by splitting the discrete spectrum into defined frequency bands, calculating the power spectrum value in each band, and then aggregating the results into an easy-to-interpret octave-band power spectrum.
Noise & acoustic analysis: Band-level energy distribution for equipment noise checks
Vibration evaluation: Quick band summaries for machinery vibration screening and comparisons
Product testing & QA: Consistent octave-band reporting across batches or configurations
Troubleshooting: Identify which frequency regions dominate energy during abnormal events
Baseline monitoring: Track octave-band changes over time for maintenance decisions
(Kept general to avoid adding specs not shown in the image.)
Works with time-domain signals typically used for spectrum-based analysis (e.g., vibration or acoustic signals)
Accepts discrete spectrum data from your measurement workflow and outputs octave-band power results
(Typical octave-band settings; exact controls depend on your software build.)
Octave band mode: 1/1, 1/3, 1/6, 1/12, 1/24 octave
Band power calculation: Sum/integrate power spectrum within each band
Visualization: Octave band bar chart / banded spectrum view
Result export: Octave-band values for reporting (format depends on your configuration)
Q1: What is octave band analysis?
It’s a method that divides a spectrum into frequency bands (octave bands) and computes the total power within each band, producing a simplified band spectrum.
Q2: What does “octave band power spectrum” mean?
It means the discrete spectrum is grouped into octave bands, and the power spectrum values inside each band are summed/aggregated to form band-level results.
Q3: Which octave band should I choose (1/1 vs 1/3 vs 1/24)?
1/1 octave: fastest, most summarized
1/3 octave: common balance of detail and readability
1/6 to 1/24 octave: higher resolution when you need finer band separation
Q4: Is this only for acoustics?
No. Octave band analysis is widely used in both noise and vibration tasks—anywhere a banded energy view is helpful.
Q5: Can octave band results replace FFT?
They complement FFT. Octave bands are ideal for summary and comparison, while FFT is better for pinpointing exact frequencies.