
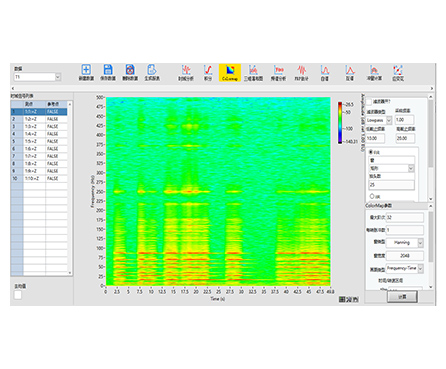
HP-STAP Colormap Analysis Software visualizes how frequency and order change over time using an intuitive color map (spectrogram-style) display. It is ideal for transient, variable-speed, or time-varying signals where a single FFT cannot show when changes happen.
| See changes over time | Clearly displays how frequency/order evolves instead of compressing everything into one spectrum |
|---|---|
| Fast interpretation | Color intensity makes trends and events easy to spot (harmonics, bursts, shifts) |
| Works for variable-speed cases | Useful when order content changes with speed and must be tracked in time |
| Flexible setup | Includes both filter settings and colormap settings for better feature visibility |
| Better troubleshooting | Helps pinpoint when abnormal components appear during operation |
Series: HP-STAP
Product Type: Colormap analysis / spectrogram visualization software
Core Display: Color map showing frequency (or order) intensity over time
Visualization Targets:
Frequency vs time
Order vs time
Parameter Controls: Filter parameters + Colormap parameters
Many vibration and acoustic signals evolve over time—especially during start/stop, speed changes, or intermittent events. HP-STAP’s colormap module turns these changes into a clear color image, where color intensity represents energy/amplitude. With built-in parameter settings for both filtering and colormap rendering, engineers can highlight key features and track how frequency/order content progresses through time.
Run-up / coast-down visualization (frequency & order progression over time)
Rotating machinery diagnostics with intermittent or time-varying signatures
Impact/transient event identification in vibration signals
Noise & acoustic investigations where frequency content changes over time
Condition monitoring review for time-localized anomalies
(Kept general to avoid adding specs not shown in the image.)
Works with time-domain signals typically used in vibration/acoustic testing and monitoring
Suitable for datasets where time-based visualization of spectral content is required
(Based strictly on the image’s feature bullets—no invented numeric ranges.)
Colormap visualization: frequency/order changes over time shown via color cloud map
Filter parameter settings: supports pre-processing to enhance target frequency bands
Colormap parameter settings: controls for map rendering and visualization clarity
Q1: What is “colormap analysis” in signal processing?
It’s a visualization method that shows how spectral content changes over time using colors, similar to a spectrogram.
Q2: What can HP-STAP colormap display?
It can display how frequency and order vary with time, with color intensity representing energy/amplitude.
Q3: Why use a colormap instead of a normal FFT?
FFT shows frequency content but does not show when it occurs. Colormap helps you identify time-localized events and evolving patterns.
Q4: Can I adjust settings to highlight certain features?
Yes. The module includes both filter parameters and colormap parameters to improve visibility of specific components.
Q5: Is this useful for variable-speed machinery?
Yes. Variable-speed operation often causes changing orders and shifting frequency content, which colormap visualization can reveal clearly.