
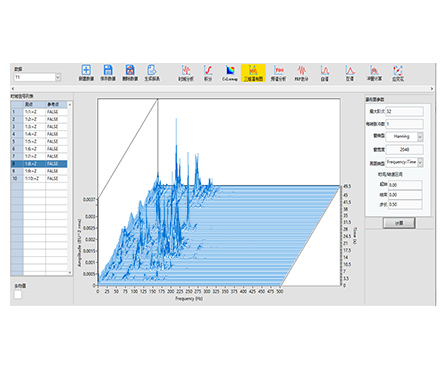
HP-STAP 3D Waterfall Plot Analysis Software provides a 3D waterfall visualization for signals and spectra, using the same workflow and parameter settings as a Colormap display—while upgrading the presentation from a 2D color map to a 3D waterfall plot. It clearly shows how frequency (or order) changes over time and how amplitude evolves.
| Colormap-like ease, 3D clarity | Use the same settings as Colormap, but view results as a 3D waterfall plot |
|---|---|
| Better pattern recognition | Quickly spot shifting peaks, emerging harmonics, and transient components |
| Time-based insight | Clearly shows frequency (or order) changes over time and the corresponding amplitude evolution |
| Presentation-ready output | 3D plots are ideal for technical reports, reviews, and customer-facing demonstrations |
Series: HP-STAP
Product Type: 3D waterfall plot analysis / 3D spectrum visualization software
Display Style: 3D waterfall plot (3D spectrum “waterfall” view)
Colormap-Compatible Workflow: Same signal list, parameter settings, and display region selection as Colormap
Purpose: More intuitive visualization of frequency/order vs time and amplitude evolution
When engineers analyze changing conditions—such as varying speed, transient events, or long recordings—2D displays can hide details. HP-STAP’s 3D waterfall module keeps the familiar Colormap setup but renders results in a 3D waterfall form, so you can see the spectrum “stack” over time more clearly. This makes it easier to interpret how spectral components rise, fall, or shift as operating conditions change.
Rotating machinery diagnostics where frequency components evolve over time
Run-up / coast-down visualization (frequency or order trends through transients)
Long-duration monitoring analysis for peak drift and intermittent events
Comparing multiple datasets to see how spectral patterns change over different test conditions
Training and reporting—presenting complex spectra in a more intuitive 3D format
(Kept general to avoid adding specs not shown in the image.)
Works with time-domain measurement data commonly used for spectral analysis (e.g., vibration/acoustic signals)
Suitable for datasets where time-based evolution of spectrum or order content needs to be visualized
(Based on the image text—no invented numeric limits.)
Signal list & region selection: aligned with Colormap workflow
Parameter settings: consistent with Colormap settings
Visualization: 2D color cloud map upgraded to a 3D waterfall plot
Core outputs: intuitive display of frequency/order vs time, and changes in amplitude over time
Q1: What is a 3D waterfall plot used for?
It visualizes how the spectrum evolves over time by stacking spectral slices in 3D, making it easier to see shifting peaks and transient behavior.
Q2: How is this different from a Colormap (spectrogram)?
The setup is similar, but the display changes from a 2D color map to a 3D waterfall plot, which can be more intuitive for tracking changes across time.
Q3: Do I need to reconfigure parameters if I already use Colormap?
No. This module uses the same signal list and parameter settings as Colormap, only changing how results are visualized.
Q4: Can it show order changes over time as well?
Yes. The description indicates it can reflect frequency and order changing over time, along with amplitude changes.
Q5: Is it mainly for analysis or also for reporting?
Both. It supports analysis, and the 3D waterfall format is also highly useful for presentations and reports.