
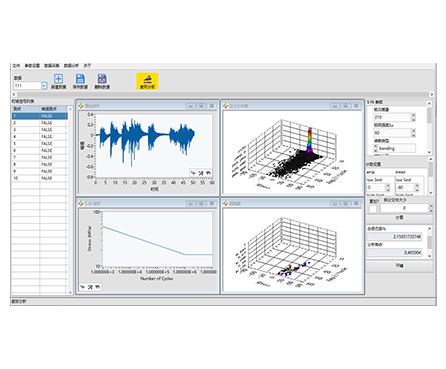
HP-STAP Fatigue Analysis Software helps you quantify structural fatigue damage by comparing real test measurements from a structure with laboratory fatigue data from material specimens. Using the S–N (Wöhler) curve, it estimates cumulative damage and predicts fatigue life to support design verification.
| Damage quantification from real measurements | Estimate the structure’s fatigue damage by comparing measured test data with lab fatigue data |
|---|---|
| S–N / Wöhler curve based modeling | Use a proven fatigue characterization method for material behavior (S = cyclic stress, N = failure cycles) |
| Cumulative damage estimation | Evaluate total fatigue damage for materials or components under specific environmental loading |
| Life prediction & compliance check | Estimate fatigue life and verify whether parts meet design requirements |
Series: HP-STAP
Product Type: Fatigue analysis & fatigue life prediction software
Core Method: Material S–N curve (Wöhler curve) fatigue characterization
What It Delivers:
Structural damage estimation based on measured test data vs. lab fatigue data
Total (cumulative) damage estimation under specific environmental loads
Fatigue life estimation and design requirement validation
Fatigue failures often occur after long-term cyclic loading, even when peak loads are not extreme. HP-STAP bridges the gap between lab-tested material fatigue behavior and real structural test measurements. By applying the material’s S–N (Wöhler) curve—where S = cyclic stress and N = cycles to failure—the software helps estimate how much damage a structure has accumulated and how long key parts may last under defined load conditions.
Structural durability testing and validation (prototype or production verification)
Fatigue assessment of components under cyclic environmental loads
Engineering design checks for fatigue life targets
Reliability evaluation for parts where long-term cycling is a key risk
Comparing test conditions vs. expected service loading to assess remaining life
(Kept strictly aligned with the image text, without adding unshown hardware specs.)
Accepts measured structural test data (real measurement results from structural testing)
Uses laboratory fatigue data from material specimens, represented by S–N (Wöhler) curves
Suitable for workflows where cyclic stress/load histories are evaluated against material fatigue characteristics
(No numeric ranges added—only what’s implied by the feature description.)
S–N (Wöhler) curve input: material fatigue characteristic curve
S = cyclic stress
N = cycles to failure
Measured test data input: actual measurement data from structural testing
Environmental load condition definition: evaluate damage under specified load scenarios
Outputs:
Estimated structural/component damage level
Estimated fatigue life for materials or parts
Design requirement verification (meets / does not meet)
Q1: What is an S–N curve (Wöhler curve)?
It describes a material’s fatigue behavior using S (cyclic stress) versus N (cycles to failure), and it is commonly used for fatigue analysis and life prediction.
Q2: How does HP-STAP estimate structural fatigue damage?
It compares real structural test measurement data with lab fatigue data from material specimens and uses the material’s S–N curve to estimate the structure’s damage level.
Q3: Can it estimate cumulative fatigue damage under specific loads?
Yes. Based on the material’s fatigue characteristics, the software can estimate total (cumulative) fatigue damage for materials or components under specified environmental loading.
Q4: Can I use it for fatigue life prediction and design validation?
Yes. It can estimate the fatigue life of materials or parts and help verify whether the design meets the required fatigue targets.
Q5: What kinds of projects benefit most from this module?
Projects involving cyclic loading, durability testing, or long-term reliability evaluation—especially where fatigue failure is a key risk.