
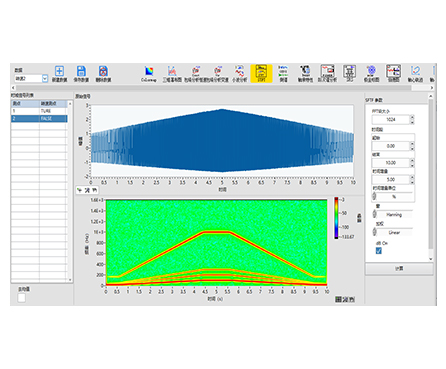
HP-STAP Time-Frequency Analysis Software provides multiple time-frequency analysis techniques to reveal frequency components in non-stationary signals. Results are visualized as a 3D spectrum (frequency vs. time) and as clear color maps, helping engineers quickly identify transient events and time-varying patterns.
| Analyze non-stationary signals confidently | Designed to extract time-varying frequency content that a single FFT may miss |
|---|---|
| 3D time-frequency spectrum output | Clear representation of frequency vs. time behavior |
| Color map visualization | Fast interpretation with colorized results for trend and pattern recognition |
| Complete signal view | Shows both raw time-domain signals and analysis results in one workspace |
| Multiple methods in one tool | Switch between STFT, wavelet, envelope, and order analysis depending on the signal type |
Series: HP-STAP
Product Type: Time-frequency analysis software
Designed For: Non-stationary signal analysis (signals whose frequency content changes over time)
Visualization: Frequency–time 3D spectrum + color plot display
Built-in Methods: STFT, envelope analysis, wavelet analysis, order analysis
When signals are non-stationary, a standard FFT spectrum can hide key details because it compresses time information. HP-STAP solves this by combining several time-frequency approaches so you can see what frequency happens, at what time, and how it evolves. The software also displays original time-domain waveforms alongside colorized frequency-domain/time-frequency results, making diagnosis and reporting more straightforward.
Diagnosing transient or time-varying vibration events in rotating machinery
Run-up / coast-down analysis where frequency changes over time
Variable-speed equipment analysis using order tracking / order analysis
Impact, resonance, modulation, or intermittent fault feature investigation
Non-stationary acoustic/noise signal inspection and comparative studies
(Kept general to avoid adding specs not shown in the image.)
Works with time-domain signals collected from common measurement channels used in condition monitoring and testing (e.g., vibration/acoustic signal inputs)
Suitable for workflows that require comparing time waveform + time-frequency results in a single analysis session
(Typical configurable items for time-frequency tools; exact options depend on your software build.)
STFT (Short-Time Fourier Transform): windowing-based time-frequency representation
Wavelet analysis: multi-resolution time-frequency feature extraction
Order analysis: frequency components expressed by orders (useful for variable speed)
Envelope analysis: supports envelope-based feature enhancement
Display outputs: raw time signal + colorized time-frequency results + 3D spectrum view
Analysis controls: selectable analysis range / resolution settings (per method)
Q1: What problem does time-frequency analysis solve?
It reveals how frequency content changes over time—especially useful for non-stationary signals where events are transient, intermittent, or speed-dependent.
Q2: What is STFT used for?
STFT shows a time-varying spectrum using a sliding window. It’s commonly used to generate a spectrogram for quick interpretation.
Q3: Why use wavelet analysis instead of STFT?
Wavelets can provide better detail at multiple resolutions, which helps when signals contain both short transients and slower-changing components.
Q4: What is order analysis?
Order analysis is widely used for rotating machinery under variable speed. It expresses spectral components as orders linked to rotational speed, improving interpretability during run-up/coast-down.
Q5: Does the software show the original waveform too?
Yes. The software provides display of the original time-domain signal along with colorized analysis results, supporting faster review and reporting.